
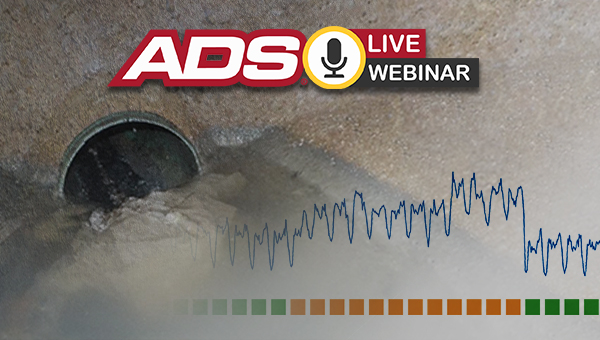
Managing Sewer Blockages Series
Blockages are a leading cause of sanitary sewer overflows (SSOs), often resulting from grease, roots, and debris build-up. As a key focus of managers and supervisors, collection system O&M maintenance processes are built around their prevention and can consume as much as 60% of the operations budget. Faced with limitations to funding, personnel and time, utilities seeking relief have adopted more sustainable and productive technology-based solutions that alleviate these limitations and improve SSO prevention. This technology-based O&M solution, its supporting technology, and its positive financial impact is presented in a two-part webinar series appropriate for directors, managers and supervisors.
- Watch PART 1: Concepts and Technologies | September 22, 2020
- SPEAKER: Jay Boyd and Kevin Enfinger, P.E.
- TIME: 1 hour
- DESCRIPTION: Part 1 examines and evaluates current O&M practices for the prevention of SSOs, specifically cleaning. It looks at long-in-use guidance provided by Capacity, Management, Operation, and Maintenance (CMOM) programs. For more than two decades, these practices have lowered the occurrence of SSOs, yet the decades-old practice of rigorous, unending cleaning has diminishing returns for lowering SSOs. Aging infrastructure and budget constraints are heightening O&M demands without adequate resources to meet them. Decades-old practices may no longer be sustainable.The utility response is then discussed showing how their successful adoption of technology gives them collection system visibility by delivering data and information to users. With this visibility, O&M assets are more intelligently deployed. The technology includes advanced, predictive analytics based on machine learning enabling users to see developing blockages, prioritize urgencies, and act in a targeted manner. The decades-old, schedule-driven process is transformed to a data-driven process with significantly higher efficiency.
- Watch PART 2: Technologies and Applications | September 29, 2020
- SPEAKER: Jay Boyd and Kevin Enfinger, P.E.
- TIME: 1 hour
- DESCRIPTION: Part 2 provides a quick overview of Part 1, then dives into a deeper discussion of ML, where we use an ML-based application in sewer blockage prediction as a case study. While ML is a commonly used phrase today, it is often not completely understood how it works in wastewater applications, and more importantly, the benefits that can be realized. Examples of this technology in operation are provided, allowing collection system managers and supervisors to see how to use Smart Water technology to make informed decisions.Case studies are illustrated through several business cases that include quantifiable productivity measures and return on investment.

Scattergraph Principles and Practice – Series
The scattergraph is a powerful tool that displays depth and velocity data from a sewer flow monitor, and the resulting patterns form characteristic signatures that provide insight into conditions within a sewer. The Scattergraph Principles and Practice webinar series is designed as an educational resource for wastewater professionals to understand how to use scattergraphs to recognize various flow conditions and understand how they impact sewer capacity and performance. This topic will be covered in a multi-part series.
- Watch PART 1: Fundamentals | April 7, 2020
- SPEAKER: Kevin Enfinger, P.E.
- TIME: 1 hour
- DESCRIPTION: The purpose of Part 1 is to provide a basic understanding of scattergraphs, including the fundamentals on which they are built. An overview of uniform flow conditions is provided, as well as the Manning Equation that represents them. Insights that can be gained by viewing flow monitor data through the lens of the Manning Equation will also be discussed. Important things can be learned by noting when they agree and when they disagree. These fundamentals provide a basic understanding of scattergraphs and serve as building blocks to more advanced principles to follow in this webinar series.
- Watch PART 2: Backwater and Surcharge Conditions | April 21, 2020
- SPEAKER: Kevin Enfinger, P.E.
- TIME: 1 hour
- DESCRIPTION: The purpose of Part 2 is to discuss backwater and surcharge conditions in sewers, including how to recognize them in scattergraphs of flow monitor data. Iso-Quantity or iso-Q™ lines will be introduced and used to demonstrate the effects backwater and surcharge conditions have on sewer capacity and sewer performance.
- Watch PART 3: SSOs and CSOs | May 5, 2020
- SPEAKER: Kevin Enfinger, P.E.
- TIME: 1 hour
- DESCRIPTION: The purpose of Part 4 is to discuss how to evaluate the performance of pump stations, siphons, valves, and related structures under certain conditions. A flow monitor located upstream from such structures can provide important information about their operating characteristics. This information is revealed any time a flow monitor operates within backwater conditions influenced by them. The addition of iso-Q™ lines to a scattergraph allows their actual performance to be compared to anticipated performance. Practical examples from flow monitor locations throughout the United States are provided, demonstrating the scattergraph signatures of approach conditions to them.
- Watch PART 4: Pump Stations, Siphons, Valves, and Other Structures | May 19, 2020
- SPEAKER: Kevin Enfinger, P.E.
- TIME: 1 hour
- DESCRIPTION: The purpose of Part 3 is to discuss sanitary sewer overflows (SSOs) and combined sewer overflows (CSOs), including how to recognize them in scattergraphs of flow monitor data. Practical examples from flow monitor locations throughout the United States are provided, demonstrating the scattergraph signatures of SSOs and combined sewer overflows CSOs under various conditions. Techniques are also developed to estimate their duration and volume from flow monitor data.
- Watch PART 5: Subcritical and Supercritical Flow | June 2, 2020
- SPEAKER: Kevin Enfinger, P.E.
- TIME: 1 hour
- DESCRIPTION: The purpose of Part 5 is to discuss the practical application of the Froude Number to flow monitoring. Engineers are aware of the instability associated with critical flow conditions and are generally advised to avoid them during sewer design. However, such conditions are often encountered in existing sewers and can impact the reliability of flow monitor data. The Froude number (Fr) is a dimensionless number used to describe flow conditions within a sewer. These conditions can be illustrated on a scattergraph using iso-Froude lines. Certain flow conditions such as hydraulic jumps, sewer bores, and undular jumps are readily identified by evaluating flow monitor data with respect to iso-Froude lines. Practical examples from flow monitor locations are provided, demonstrating the scattergraph signatures of various transcritical and near-critical phenomena. Flow monitors can operate well in sewers under subcritical and supercritical condition, but accuracy may deteriorate near the transition. Such conditions should be avoided when possible in flow monitoring applications.
- Watch PART 6: Flow Monitor Performance | June 16, 2020
- SPEAKER: Kevin Enfinger, P.E.
- TIME: 1 hour
- DESCRIPTION: The purpose of Part 6 is to discuss how to evaluate the performance of a flow monitor. Previous webinars in this series have discussed characteristic scattergraph patterns that reveal insight into sewer performance and capacity. However, the flow monitor data also leave distinct patterns that allow the performance of the flow monitor itself to be evaluated as well. Practical examples from flow monitor locations are provided, demonstrating the scattergraph signatures of flow monitors that are operating as expected and some that are not. Best management practices to obtain high-quality data will be discussed, as well as what to do when data quality is less than expected.
- Watch PART 7: Self-Cleansing in Existing Sewers | June 30, 2020
- SPEAKER: Kevin Enfinger, P.E.
- TIME: 1 hour
- DESCRIPTION: The purpose of Part 7 is to discuss how to evaluate self-cleansing conditions in sewers. The Tractive Force Method is used to design sewers with self-cleansing conditions based on a critical shear stress, and this approach can also be extended to the evaluation of existing sewers under actual conditions. Self-cleansing conditions are assessed by evaluating flow monitor data on a scattergraph using a critical shear stress curve. Existing sewers with adequate self-cleansing conditions are readily identified, as well as those with a potential for silt, sediment, or debris accumulation. Practical examples from flow monitor locations throughout the United States are provided, demonstrating the application of the Tractive ForceMethod to existing sewers.

CSO Smart Data Webinar: IDEX/ADS Environmental Services Innovations in CSO Data Use
Cities are now using continuous data collection from flow/level metering and rain gauges in collection systems for both control and planning to meet regulatory requirements while optimizing costs. Ft Wayne, IN is operating under a consent decree that anticipates an expenditure of $23 million on new interceptors and storage facilities. They have a network of 100 flow meters, 10 depth monitors and 29 rain gauges that provide real-time feedback in their combined and separated sewer collection system. Data and an innovative understanding of timing of flows in an interceptor has allowed them to reduce the anticipated cost to $5 million.
- Watch CSO Smart Data Webinar | April 8, 2020
- SPEAKER: Patrick Stevens, P.E., Mike Armes, Wendy Reust, P.E.
- TIME: 1 hour

Elements to Successful Rainfall Monitoring Series
Important engineering decisions are made every day regarding sanitary sewer, combined sewer, and storm sewer systems and often require the use of rainfall data. See how selecting the right equipment in the right quantities for your local rainfall conditions and your specific applications will lead to a successful rainfall monitoring program.
- Watch PART 1: Successful Planning | February 18, 2020
- SPEAKER: Kevin Enfinger, P.E.
- TIME: 1 hour
- Watch PART 2: Successful Deployment, Operation, and Maintenance | March 17, 202
- SPEAKER: Kevin Enfinger, P.E.
- TIME: 1 hour